In Table 1-2 (pdf format) , characteristic K, L, and M x-ray line energies are given for elements with 3 £ Z £ 95. Only the strongest lines are included: Ka1, Ka2, Kb1, La1, La2, Lb1, Lb2, Lg1, and Ma1. Wavelengths, in angstroms, can be obtained from the relation l = 12,3984/E, where E is in eV. The data in the table were based on Ref. 1, which should be consulted for a more complete listing. Widths of the Ka lines can be found in Ref. 2.

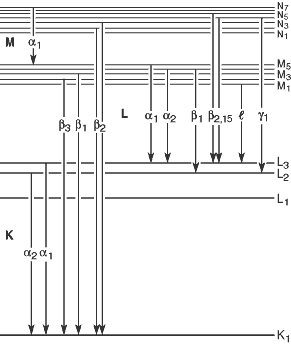
Fig 1-1. Transistions that give rise to the various emission lines.
Table 1-3 (pdf format) provides a listing of these, and additional, lines (arranged by increasing energy), together with relative intensities. An intensity of 100 is assigned to the strongest line in each shell for each element. Figure 1-1 illustrates the transitions that give rise to the lines in Table 1-3.
REFERENCES
1. J. A. Bearden, “X-Ray Wavelengths,” Rev. Mod. Phys. 39, 78 (1967).
2. M. O. Krause and J. H. Oliver, “Natural Widths of Atomic K and L Levels, Ka X-Ray Lines and Several KLL Auger Lines,” J. Phys. Chem. Ref. Data 8, 329 (1979).